By: ChrisRackauckas
Re-posted from: http://www.pkgupdate.com/?p=18
Introduction to Pkg Update
Welcome to Pkg Update. This new blog focuses on the Julia package ecosystem: how packages/organizations are changing, what new projects you should be aware of, and how Base issues are propagating through the package-sphere. I hope that this will be a nice summary of the vast changes that happen throughout the Julia ecosystem. I want this to be a resource which both package users and package developers could read to get a general understanding of the big movements in the community. The goal is to link together issues/PRs/discussions from the the vast number of repositories to give a coherent idea of what changes to anticipate and congratulate. As Base continues to slim (for those who don’t know, there’s a trend for Base to become slimmer for a leaner install, with more functionality provided by the Julia organizations such as JuliaMath), I hope this helps you stay up to date with where everything is going!
While I try my best to be active throughout the Julia-sphere, this is not something that can be done alone. Please feel free to contact me via email, Twitter, or Gitter to give a summary of what’s going on in your organization / area of expertise. Also, if anyone is willing to join the Pkg Update team, I would be happy to have you! I am looking for correspondents to represent different Julia organizations and to help summarize the changes.
That said, here’s a quick highlight of some recent updates both users and developers might need to know.
JuliaMath: Exciting Developments in LibM.jl
I have to give a shoutout to @musm for his incredible work in Libm.jl. This project started with a discussion on whether Julia should continue to use OpenLibm (Libm is the math library which supplies the approximations for common functions like “sin” and “exp”). From this discussion the ambitious idea of creating a pure-Julia Libm was put forward, and Libm.jl has continued with the momentum.
Sleef is a C library notable for it’s use of SIMD. Libm.jl is largely based on a port of that code to Julia, it also has some added safety and correctness for edge cases over the original code. While the ported code is based on the non-SIMD parts of the C source, it reliably takes advantage f SIMD hardware none-the-less — thanks to LLVM autovectorisation . The code is particularly vectorisation friendly, as it uses next-to-no branches or table lookups Most of the benchmarks for this implementation are within 2x of C programs calling Sleef. In practice, because of how lining and FFI works, this means that using the julia Sleef implementation is significantly faster than ccalling the C sleef library. Not to mention safer.
Other libraries (Musl and Cephes) now have partial ports to Julia as well. There is work being done to use the strategies of these libraries together to build an even better Libm which might be dubbed Amal.jl. This library, being a Julia implementation, will have much broader support for the type system, including native implementations for Float16 and quad-precision floats, leading to a much more robust mathematical foundation.
JuliaStats API Decision: Degrees of Freedom as “dof”
This issue and the associated PR went through rather quickly. It highlighted the fact that until now, degrees of freedom in the stats packages had a tendency to use “df”, which is a naming conflict with using “df” as an instance for a DataFrame (a very common usage). The decision was to change the naming for degrees of freedom to dof. Since this change is in StatsBase, you can expect that this convention will propagate throughout the statistics stack: “df” for dataframes and “dof” for degrees of freedom.
JuliaDiffEq: Upcoming Sundials API Update
Sundials.jl, the interface to the popular ODE suite, has recently undergone a large overhaul to help improve the wrapper and to stop memory leaks. This is being combined with major changes to the “simplified interface” and an upgrade in the Sundials version. Thus the upcoming tag will be a minor release with some breaking but exciting improvements, including the ability to use the Sundials ARKODE solvers.
JunoLab: The Plot Pane is Taking Off
With the Julia v0.5 release, Juno released a new version of their stack which included an updated plot pane. The developers were rallied and many plotting packages now support the plot pane. This includes support from Plots.jl, meaning that the plots will plot in the plot pane if the backend is compatible. While Plotly is not compatible with the plot pane, a recent PR has added plot pane compatibility to PlotlyJS. PyPlot and GR are compatible with the plot pane. Also, compatibility with Gadfly has been added. This means that, at least on the master version of the Juno stack and the plotting packages, the plot pane is all working! For regular users you may want to wait for this all to be released, but if you’re brave, it’s already ready for testing and I have been making good use of it. Note that in Plots.jl you can still use the `gui()` command to open up the non-plot pane window. This can be useful since some plotting backends (like PyPlot) are not interactive in the plot pane.
JuliaML Manifesto Released, and Major Progress Ensues
If you haven’t read Tom Brelof’s JuliaML manifesto, I would take a good look at it. He gives an introduction to JuliaML, the new machine learning based Julia organization, and shows how the Learn ecosystem is leading to an easy-to-use but highly extendable API. If you’re interested in machine learning, this is an organization to start following. Lots of progress is happening over here.
New Package Highlights
Lastly, I would like to finish off each post by highlighting some newer and promising projects. Since this is the first post and there’s lots to say, I picked a few.
ParallelDataTransfer.jl
(Disclaimer: this is one of my own libraries) ParallelDataTransfer.jl has hit the top of the 14-day change chart on Julia Pulse, rapidly picking up steam since it’s new release. The package is pretty simple: it offers a easy-to-use API for performing safe data transfers between processes. The README also shows how to use the library within type-stable functions, giving an easy way to construct highly parallel Julia algorithms.
Query.jl
Another package showing large movement on the Julia Pulse is Query.jl. This package allows you to query from Julia data sources, including any iterable, DataFrames, and Arrays. It even allows for queries through DataStreams sources, effectively connecting the queries to CSVs and SQLite databases. It’s not hard to see the promising future that has.
RNG.jl
A Google Summer of Code project which has caught my attention is RNG.jl. This package does exactly what you’d expect: it implements a bunch of random number generators. The benchmarks show that there are some promising RNGs which are both fast and suitable for parallel usage. I could see this library’s RNGs as becoming a staple for many Julia packages.
That’s the End of the First Post!
Let me know what you think of this new blog. I tried to cover as wide of a range as I could, but to get a better sense of the even larger community, I will need your help. Let me know if you’re willing to be an organization correspondent who can write one of many (multiple) dispatches, or if you don’t have the time, feel free to submit stories when possible.
 denote consumption and
  denote leisure. Consider an agent who wishes to maximize Cobb-Douglas utility over consumption and leisure, that is,
 =")
 .
. is the relative preference for consumption. The budget constraint is given by,
w_i(1-l_i)+\epsilon_i") ,
, is the wage observed in the data,
  is other income that is not observed in the data, and
  is the tax rate.
") subject to the budget constraint. We assume that non-labor income is uncorrelated with the wage offer, so that
subject to the budget constraint. We assume that non-labor income is uncorrelated with the wage offer, so that ![\mathbb{E}[\epsilon_i | w_i]=0](https://s0.wp.com/latex.php?latex=%5Cmathbb%7BE%7D%5B%5Cepsilon_i+%7C+w_i%5D%3D0&bg=ffffff&%23038;fg=333333&%23038;s=0 "\mathbb{E}[\epsilon_i | w_i]=0") . Although this assumption is a bit unrealistic, as we expect high-wage agents to also tend to have higher non-labor income, it helps keep the example simple. The model is also a bit contrived in that we treat the tax rate as unobservable, but this only makes our job more difficult.
. Although this assumption is a bit unrealistic, as we expect high-wage agents to also tend to have higher non-labor income, it helps keep the example simple. The model is also a bit contrived in that we treat the tax rate as unobservable, but this only makes our job more difficult. and
and ^N_{i=1}") and the assumed structure. In particular, the econometrician is interested in the policy-relevant parameter
and the assumed structure. In particular, the econometrician is interested in the policy-relevant parameter ") , where,
, where, \equiv \mathbb{E}_{\epsilon} \frac{\partial}{\partial \tau} C(w_i,\epsilon; \gamma, \tau)") ,
,") denotes the demand for consumption.
denotes the demand for consumption. ") is the marginal propensity for an agent with wage
is the marginal propensity for an agent with wage  is the population average marginal propensity to consume in response to the tax rate. Of course, we can solve the model analytically to find that
  = -\gamma w_i") and
and  , where
  is the average wage, but we will show that the numerical methods achieve the correct answer even when we cannot solve the model.
 = \gamma (1-\tau) w_i + \gamma \epsilon_i")
 = (1-\gamma) + \frac{(1-\gamma) \epsilon_i}{ (1-\tau) w_i}")
 and
and  that agents in this model would choose. We implement this in Julia as follows:
 ,
, ") ,
,  , and
, and  . We draw the wage to have distribution
 ") , but this is arbitrary.
, but this is arbitrary.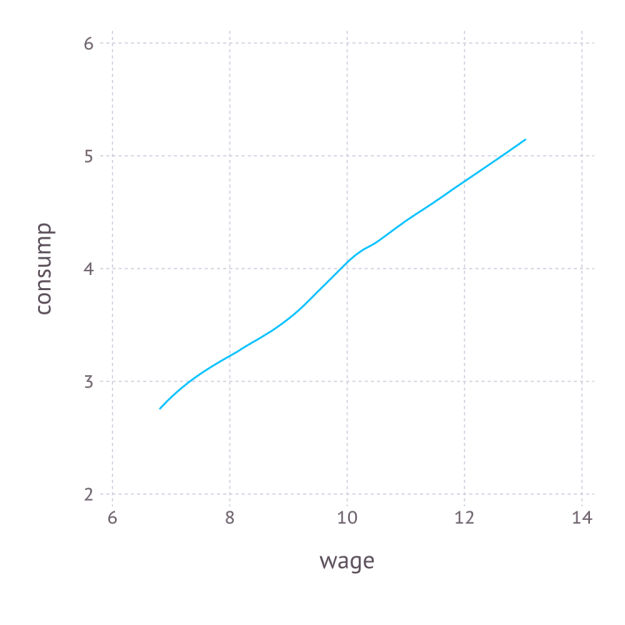
 values of
  :
: for each
  , we have enough information to simulation
  and
and  , for each
 ") and
and ") . With these, we can define the moments,
. With these, we can define the moments,![\hat{m}\left(\gamma,\tau\right)=\mathbb{E}_{\epsilon}\left[\begin{array}{c} \frac{1}{N}\sum_{i}\left[\hat{c}_{i}\left(\epsilon\right)-c_{i}\right]\\ \frac{1}{N}\sum_{i}\left[\hat{l}_{i}\left(\epsilon\right)-l_{i}\right] \end{array}\right]](https://s0.wp.com/latex.php?latex=%5Chat%7Bm%7D%5Cleft%28%5Cgamma%2C%5Ctau%5Cright%29%3D%5Cmathbb%7BE%7D_%7B%5Cepsilon%7D%5Cleft%5B%5Cbegin%7Barray%7D%7Bc%7D+%5Cfrac%7B1%7D%7BN%7D%5Csum_%7Bi%7D%5Cleft%5B%5Chat%7Bc%7D_%7Bi%7D%5Cleft%28%5Cepsilon%5Cright%29-c_%7Bi%7D%5Cright%5D%5C%5C+%5Cfrac%7B1%7D%7BN%7D%5Csum_%7Bi%7D%5Cleft%5B%5Chat%7Bl%7D_%7Bi%7D%5Cleft%28%5Cepsilon%5Cright%29-l_%7Bi%7D%5Cright%5D+%5Cend%7Barray%7D%5Cright%5D&bg=ffffff&%23038;fg=333333&%23038;s=0 "\hat{m}\left(\gamma,\tau\right)=\mathbb{E}_{\epsilon}\left[\begin{array}{c} \frac{1}{N}\sum_{i}\left[\hat{c}_{i}\left(\epsilon\right)-c_{i}\right]\\ \frac{1}{N}\sum_{i}\left[\hat{l}_{i}\left(\epsilon\right)-l_{i}\right] \end{array}\right]")
![\left(\hat{\gamma},\hat{\tau}\right)=\arg\min_{\gamma\in\left[0,1\right],\tau\in\left[0,1\right]}\hat{m}\left(\gamma,\tau\right)'W\hat{m}\left(\gamma,\tau\right)](https://s0.wp.com/latex.php?latex=%5Cleft%28%5Chat%7B%5Cgamma%7D%2C%5Chat%7B%5Ctau%7D%5Cright%29%3D%5Carg%5Cmin_%7B%5Cgamma%5Cin%5Cleft%5B0%2C1%5Cright%5D%2C%5Ctau%5Cin%5Cleft%5B0%2C1%5Cright%5D%7D%5Chat%7Bm%7D%5Cleft%28%5Cgamma%2C%5Ctau%5Cright%29%27W%5Chat%7Bm%7D%5Cleft%28%5Cgamma%2C%5Ctau%5Cright%29&bg=ffffff&%23038;fg=333333&%23038;s=0 "\left(\hat{\gamma},\hat{\tau}\right)=\arg\min_{\gamma\in\left[0,1\right],\tau\in\left[0,1\right]}\hat{m}\left(\gamma,\tau\right)'W\hat{m}\left(\gamma,\tau\right)")
 is a
is a  weighting matrix, which is only relevant when the number of moments is greater than the number of parameters, which is not true in our case, so
 ![\left(\hat{\gamma},\hat{\tau}\right)=\arg\min_{\gamma\in\left[0,1\right],\tau\in\left[0,1\right]}\left\{ \mathbb{E}_{\epsilon}\left[\frac{1}{N}\sum_{i}\left[\hat{c}_{i}\left(\epsilon\right)-c_{i}\right]\right]\right\} ^{2}+\left\{ \mathbb{E}_{\epsilon}\left[\frac{1}{N}\sum_{i}\left[\hat{l}_{i}\left(\epsilon\right)-l_{i}\right]\right]\right\} ^{2}](https://s0.wp.com/latex.php?latex=%5Cleft%28%5Chat%7B%5Cgamma%7D%2C%5Chat%7B%5Ctau%7D%5Cright%29%3D%5Carg%5Cmin_%7B%5Cgamma%5Cin%5Cleft%5B0%2C1%5Cright%5D%2C%5Ctau%5Cin%5Cleft%5B0%2C1%5Cright%5D%7D%5Cleft%5C%7B+%5Cmathbb%7BE%7D_%7B%5Cepsilon%7D%5Cleft%5B%5Cfrac%7B1%7D%7BN%7D%5Csum_%7Bi%7D%5Cleft%5B%5Chat%7Bc%7D_%7Bi%7D%5Cleft%28%5Cepsilon%5Cright%29-c_%7Bi%7D%5Cright%5D%5Cright%5D%5Cright%5C%7D+%5E%7B2%7D%2B%5Cleft%5C%7B+%5Cmathbb%7BE%7D_%7B%5Cepsilon%7D%5Cleft%5B%5Cfrac%7B1%7D%7BN%7D%5Csum_%7Bi%7D%5Cleft%5B%5Chat%7Bl%7D_%7Bi%7D%5Cleft%28%5Cepsilon%5Cright%29-l_%7Bi%7D%5Cright%5D%5Cright%5D%5Cright%5C%7D+%5E%7B2%7D&bg=ffffff&%23038;fg=333333&%23038;s=0 "\left(\hat{\gamma},\hat{\tau}\right)=\arg\min_{\gamma\in\left[0,1\right],\tau\in\left[0,1\right]}\left\{ \mathbb{E}_{\epsilon}\left[\frac{1}{N}\sum_{i}\left[\hat{c}_{i}\left(\epsilon\right)-c_{i}\right]\right]\right\} ^{2}+\left\{ \mathbb{E}_{\epsilon}\left[\frac{1}{N}\sum_{i}\left[\hat{l}_{i}\left(\epsilon\right)-l_{i}\right]\right]\right\} ^{2}")
") , we need to run sim_moments(params) many times and take the unweighted average across them to achieve the expectation across
, we need to run sim_moments(params) many times and take the unweighted average across them to achieve the expectation across }{dx} \approx \frac{f(x+h)-f(x-h)}{2h}") , for some small
, for some small  , as follows:
 to be approximately
  on average, while the true value is
 \times 10=-5") , so the econometrician’s problem is successfully solved.
, so the econometrician’s problem is successfully solved.


