Getting Started with Julia Lang

By: Fabian Becker

Re-posted from: https://geekmonkey.org/getting-started-with-julia-lang/

Getting Started with Julia Lang

During my early studies and later in my career I had the opportunity to hone my engineering skills in a variety of different programming languages. I started in my early teenage years with QBasic and then progressed on to more advanced languages.

In open source projects I've largely worked on JavaScript (node.js) and PHP codebases, while my professional career has taken me to Java, Ruby (on Rails) and finally Python. Little bits of exposure left and right to newer languages like Go and Rust, but the above are the main languages I've done actual work in.

Over the years I have worked on a number of optimization problems that required the use of machine learning algorithms and libraries or the plotting of graphs. The go-to language for this has naturally been Python with its large collection of data science packages of the like of numpy, scipy, matplotlib and not to mention pytorch and tensorflow.

Now there's nothing wrong with any of the above. Python is a solid language with a long history and its grown to become the language of choice for data science. For me though, Python never felt quite right. The Zen of Python makes you think the language is opinionated and has clear structure to it. Oftentimes I found the opposite to be true. Where in Ruby (on Rails) "convention over configuration" rules the thinking Python leaves most up to the developer.

Popular web frameworks like Django and Flask come with short examples on how to build an application but leave a lot unanswered when your application starts growing. Where do routes live? Where do I put my models? As a result every project will look differently making it inherently difficult to jump into new codebases.

In a similar vein Python has the basic building blocks for OOP and functional programming, but stops there. Private variables don't really exist, static methods and class methods require the use of decorators, lambda is but a crippled version of implementations in other languages like Ruby and JavaScript, map is a built-in function while reduce was demoted to the functools package. Even though the language technically supports these paradigms you will have to look hard to find them embraced in the popular packages.

Now you could argue that I'm comparing apples with oranges and to some extend I am. After all I'm comparing frameworks and not languages. To me though both go hand in hand. You can't have a language without the packages that make up said language. Just like a human language is influenced and evolves through its speakers, a programming language and the culture around it is defined by its community and ecosystem.

To be clear though – preferences differ and I'm not arguing that Python is a bad language, quite the contrary, it has built up a large following due to it being easy to learn and having a large ecosystem. It's just not a language that satisfies me because I care about structure and ultimately that's what made me look elsewhere.

Meet Julia

Julia goes back to 2009 and was started to create a fast high-level language. It wasn't until 2012 for Julia to be first announced and publicly released and version 1.0 landed 2018.

Julia has a dynamic type system, built-in package manager, multiple dispatch, performance approaching that of C and an ability to natively interface with other languages like Python. It's designed for distributed computing and makes it trivial to run algorithms on GPUs.

The ability to natively and easily interface with other languages sticks out to me. Take a look at the following example which uses PyCall to call some Python code from within Julia:

using PyCall
math = pyimport("math")
math.sin(math.pi / 4) # returns ≈ 1/√2 = 0.70710678...
Import Python's math module in Julia (Source)

The beauty is that you can very easily mix Python and Julia this way. Python's entire ecosystem including all its great libraries are available while you can also explore Julia's ecosystem. In fact Plots.jl, a plotting library for Julia can use PyPlot as one of its backends.

A neat feature of Julia is that you can use LaTeX shortcuts in the editor. For example when you type \sqrt<TAB> most Julia editors and the Julia REPL will automatically turn this sequence into the square-root sign: √. In this case √ is also aliased to the sqrt function.  This makes Julia great for mathematical applications where you can use mathematical notation in your programs.

Getting Started with Julia Lang

Julia lends itself to scientific applications and machine learning. Tools like Flux.jl

While it's true that Julia is heavily used in research it doesn't mean that you can't also build run-of-the-mill web applications. Frameworks like Genie

Installing Julia

The easiest way to install Julia is to download the compatible package for your OS on the official website. Personally I tend to use asdf-vm as it allows me to install and run multiple versions of my favourite languages simultaneously.

With asdf-vm installing Julia becomes as easy as:

$ asdf plugin add julia
$ asdf install julia 1.6.0

REPL

Julia's REPL is different from what you may be used to from other languages. It comes bundled with a package manager and several different modes.

The main shortcuts that you'll want to remember are:

  • ] gets you into package mode, from here you can add orupdate packages and manage projects
  • ? gets you into help mode. Julia is a well documented language and the help mode will allow you to find explanations and examples for all the built-ins
  • ; is how you can enter shell mode allowing you to use a bash-like shell without leaving the Julia interpreter

Installing packages

Installing packages is straight forward. Press ] to go into package mode and then add $PackageName to install a package named $PackageName. Note that this will install packages in the globally.

A package you'll definitely want to install globally is called Revise.jl.

Revise.jl

Revise allows you to hot reload code while working in the REPL. This is especially useful in Julia since the REPL takes a little longer to start than in other languages. With Revise you can edit code in your IDE and have it reflected in the REPL immediately.

Getting Started with Julia Lang

Editors

The two main editors for Julia are Juno and Julia for VSCode. Julia for VSCode is relatively young and was introduced at the last JuliaCon in 2020. Juno is based on Atom which has seen some decline in usage over time.

Introduction to VS Code for Julia at JuliaCon 2020

Since I'm already using VSCode for all my other development using the Julia for VSCode extension was an easy decision. It has all the features present in Juno.

Conclusion

Julia is a fascinating language with a growing community and a solid package ecosystem. While the ecosystem isn't as vast as Python's, it is trivial to call out to Python, R, C and other languages.

Julia's package manager is fast, easy to use. It's a breath of fresh air when compared to the shenanigans one has to deal with in Python with pip, setuptools, conda, poetry, et.al.

The lack of object-oriented programming features is hardly noticeable once you are comfortable with multiple dispatch. In fact Julia's simplicity and well thought out type system make it easy to reason about the objects you're dealing with in code. On top of that, I find Julia very easy to learn and well positioned to attract developers, data scientists and researchers who traditionally picked Python.

First Steps #4: Digging Into DataFrames

By: Josh Day

Re-posted from: https://www.juliafordatascience.com/first-steps-4-dataframes/

First Steps #4: Digging Into DataFrames

DataFrames.jl provides the most widely used tabular data structure in Julia.  In this post we'll explore DataFrames using sample data from RDatasets.jl (and we'll plot stuff using StatsPlots).

A rather timely event: DataFrames.jl has reached version 1.0!

⚙️ Setup

First, install DataFrames and RDatasets via Pkg Mode (]) in the REPL:

(@v1.6) pkg> add DataFrames RDatasets

Now load both packages along with the diamonds dataset from R's ggplot2 package.  The diamonds data contains price/size/quality information on 53,940 different diamonds.  

julia> using DataFrames, RDatasets

julia> df = dataset("ggplot2", "diamonds")
53940×10 DataFrame
   Row │ Carat    Cut        Color  Clarity  Depth    Tabl ⋯
       │ Float64  Cat…       Cat…   Cat…     Float64  Floa ⋯
───────┼────────────────────────────────────────────────────
     1 │    0.23  Ideal      E      SI2         61.5     5 ⋯
     2 │    0.21  Premium    E      SI1         59.8     6
     3 │    0.23  Good       E      VS1         56.9     6
     4 │    0.29  Premium    I      VS2         62.4     5
     5 │    0.31  Good       J      SI2         63.3     5 ⋯
     6 │    0.24  Very Good  J      VVS2        62.8     5
     7 │    0.24  Very Good  I      VVS1        62.3     5
     8 │    0.26  Very Good  H      SI1         61.9     5
   ⋮   │    ⋮         ⋮        ⋮       ⋮        ⋮        ⋮ ⋱

🚀 DataFrames Quickstart

  • Variables (columns) of a Dataframe can be referenced either by strings or symbols, e.g. "I am a string" and :I_am_a_symbol.

Make a Copy of a Column

df[:, "Carat"]

df[:, :Carat]

Extract a Column

  • These commands retrieve the exact data held in the DataFrame.  Warning!  Making a change to the extracted data will change the values in DataFrame.
df.Carat

df[!, "Carat"]

Selecting a Subset of Columns

select(df, "Carat")

select(df, ["Carat", "Cut"])

Filtering a Subset of Rows

The syntax x -> do something with x is an anonymous function (sometimes called lambda expression).  The filter function will apply a function to each row and return back a DataFrame for the rows that returned true.

filter(row -> row.Carat > 1, df)
  • We can also use indexing (with broadcasting) rather than filter:
df[df.Carat .> 1, :]
  • For functions that accept a function as its first argument, Julia's do-block syntax can help you clean up your code.  Here we are using &&, the logical "and" operator, to create multiple filter conditions.
filter(x -> x.Carat > 1 && x.Cut == "Premium" && x.Color == "J" && 5000 <= x.Price <= 6000, df)

# Same as above, but with do-block
filter(df) do x 
    x.Carat > 1 && 
        x.Cut == "Premium" && 
        x.Color == "J" &&
        5000 <= x.Price <= 6000
end

You can now do several essential DataFrame tasks:

  • Get a single column
  • Choose a subset of columns
  • Choose a subset of rows

Next we'll use groupby and combine to apply functions across groups of data.

🤔 How does Price relate to Cut?

We are big on learning by example, so let's start by answering this relatively simple question.  First things first: What do the Price and Cut variables look like?

julia> df.Price
53940-element Vector{Int32}:
  326
  326
    ⋮
 2757
 2757

julia> df.Cut
53940-element CategoricalArrays.CategoricalArray{String,1,UInt8}:
 "Ideal"
 "Premium"
 ⋮
 "Premium"
 "Ideal"
  • Price: The cost in US Dollars.
  • Cut: The rating of cut quality.  In order (best-to-worst): "Ideal", "Premium" "Very Good", "Good", and "Fair".  Side note: The data is stored in a CategoricalArray, which uses less memory than storing each element as a separate String.

Using groupby

We can use the groupby function to group our data by the "Cut" variable.

gdf = groupby(df, :Cut)

Using our grouped DataFrame, we can then apply a function to a variable in each group using combine.  Let's get the average Price for each level of Cut:

julia> using Statistics # for `mean`

julia> combine(gdf, :Price => mean)
5×2 DataFrame
 Row │ Cut        Price_mean
     │ Cat…       Float64
─────┼───────────────────────
   1 │ Fair          4358.76
   2 │ Good          3928.86
   3 │ Very Good     3981.76
   4 │ Premium       4584.26
   5 │ Ideal         3457.54

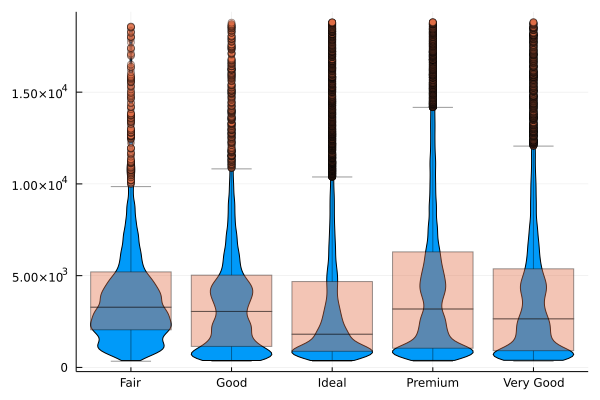
Now we know what the distribution center is for each Cut, but what about the spread and shape?

📊 Using StatsPlots

The StatsPlots package adds functionality and plot recipes to Plots.jl.  We'll use it to do the grouping for us so that we don't need groupby.  First, add StatsPlots:

(@v1.6) pkg> add StatsPlots

Next, use the @df <dataframe> <plot command> syntax to create a violin plot overlaid with a box plot for each level of Cut.

julia> @df df violin(string.(:Cut), :Price, lab="")

julia> @df df boxplot!(string.(:Cut), :Price, alpha=.4, lab="")
First Steps #4: Digging Into DataFrames
Price vs. Cut

Things to note in the code/plot above:

  • The @df macro will replace Symbols with the associated DataFrame columns.
  • We must use string.(:Cut) because Plots/StatsPlots doesn't know how to work with CategoricalArrays directly.
  • We use boxplot! (instead of boxplot) to add a new series to the existing plot.
  • We set lab (shorthand for label) to "" to avoid adding an entry to the plot legend.  If all legend entries are blank, the legend will not appear.
  • We use alpha=.4 to set the opacity of the boxplot so that it doesn't cover up the violin in the layer beneath it.

From our plot, we can see the distributions are all similarly skewed with a long right tail.  Some Cuts (Good, Premium, and Very Good) are bimodal (they have two "peaks").  However, we are ignoring some important factors (such as how Carat and Color affect the price!), so we shouldn't make any conclusions based solely on this plot.

🚀 That's It!

You now know how to do a little bit of data wrangling with DataFrames.  What do you want to learn about next?

Enjoying Julia For Data Science?  Please share us with a friend and follow us on Twitter at @JuliaForDataSci.

Additional Resources

Talk ‘Introduction to Julia and Trixi, a numerical simulation framework for hyperbolic PDEs’ on 2021-04-27

By: Hendrik Ranocha -- Julia blog

Re-posted from: https://ranocha.de/blog/Intro_Julia_Trixi/

I gave a talk
Introduction to Julia and Trixi, a numerical simulation framework for hyperbolic PDEs
in the Applied Mathematics Seminar, University of Münster, on Tuesday, 2021-04-27, 10:00 CEST.
The announcement including details how to participate is available online.

Abstract

Julia is a modern high-level programming language developed specifically
with scientific computing in mind. Trixi is a
numerical simulation framework for hyperbolic conservation laws written in Julia. A key objective
for the framework is to be useful to both scientists and students. Therefore, next to having an
extensible design with a fast implementation, Trixi is focused on being easy to use for new or
inexperienced users, including the installation and postprocessing procedures.

This presentation is a live demonstration of Julia and Trixi. Firstly, we introduce Julia and
demonstrate some of its design principles. This introduction is aimed at researchers in
numerical analysis with previous programming experience. Next, we show how to use Trixi
for setting up and running simulations, how to visualize the results, and how to extend Trixi
with new functionality. We demonstrate how key design principles of Julia are used in Trixi
and the Julia package ecosystem, e.g. to enable automatic differentiation through a complete
simulation involving hyperbolic conservation laws.

The presentation is
available as a Jupyter notebook,
including information how to set up everything.