Category Archives: Julia

Plots: Past, Present, and Future

By: Tom Breloff

Re-posted from: http://www.breloff.com/plots-past-present-future/

Earlier this year, I backed away from the Julia community to pursue a full time opportunity with the exciting AI startup Elemental Cognition as a senior engineer. Elemental Cognition was founded by Dave Ferrucci, the AI visionary that led the original IBM Watson team to victory in Jeopardy. We’re a small team (though we’re hiring!) of talented and passionate researchers and engineers, some of whom were instrumental in the success of Watson, working to build machines with common sense and reasoning (thought partners, if you will). It’s incredibly interesting, but it also doesn’t leave time for hobbies.

In this post I wanted to provide some perspective on the Plots project, from origin to today, as well as to speculate on its future. If you have further questions about this project (or any of my other open source efforts), please use the public forums (Github, Discourse, Gitter, Slack) to seek help from other users and developers, as I have very little capacity to answer emails or messages sent directly to me. (Not to mention I probably won’t have the most up to date answer!)

Past

I spent my career in finance building custom visualization software to analyze and monitor my trading and portfolios. When I started using Julia, the visualization options were not exciting. Most available packages were slow, lacking features, or cumbersome to use (or all of those things). As both the primary designer and user of my software in my previous roles, I knew a better approach was possible.

In 2015, early in my Julia experience, I created Qwt.jl, a Julia interface to a slightly customized wrapper of the Qwt visualization framework. I used it primarily to analyze trading simulations and watch networks of spiking neurons fire. It was (IMO) a massive step up in cleanliness and usability compared to my experiences doing visualization in Python, C++, and Java. I am a nut for convenience, and made sure all the defaults were set such that 90% of the time they were exactly what I wanted. Qwt.jl could be thought of as the design inspiration for the API of Plots.

In August of 2015, a bunch of devs in the Julia community (most of which had “competing” visualization packages) set up the JuliaPlot (note the missing “s”) organization to discuss the state of Julia visualization. We all agreed that the community was too fragmented but most thought it was too hard a problem to tackle properly. Each package had many strengths and weaknesses, and there was large difference in supported feature sets and API style.

I laid out a rough plan for “one interface to rule them all”. It was not well received, with the biggest objection that it wasn’t likely to be successful. People, after all, have very different preferences in naming, styles, and requirements. It would be impossible to please enough people enough of the time to make the time investment worthwhile. Now, telling me something is impossible is an effective way to motivate me. I pushed the initial commits of Plots that weekend.

Present

Plots (and the larger JuliaPlots ecosystem) has been (again, IMO) a wildly successful project. Is it perfect? Of course not. Nothing is. There are precompilation issues, unsatisfying customization of legends, minimal interactivity, and more. But it has received a large following of loyal users and (much more important) dedicated contributors and maintainers.

Sadly, I don’t have the ability to work on the project, as described above. In fact, I bet you can guess when I joined Elemental Cognition given my Github activity:

However, even though I’ve backed away from the project, it is in good hands with many people invested in its continued success. Looking at the list of contributors to Plots (64 people at the time of writing this post) and the graph of commits (below), it seems very clear that this is an active and passionate community of Julia visualizers that care about the success of the ecosystem.

In fact, this graph seems to show that activity has risen since I handed over responsibility of the organization to the JuliaPlots team. I reason that my departure gave other members the courage to take a more active role, before which their contributions were not as aggressive and passionate.

The design of RecipesBase and the recipes concept has ensured that, even if something better comes along to replace the Plots core, things like StatPlots, PlotRecipes, and many other custom recipes can still be used. This is a motivating idea when deciding whether to invest time in a project… knowing that a contributed recipe can outlast the plotting package it was designed for. This is a primary reason that I expect JuliaPlots to remain active and vibrant.

Future

There are many ways to make visualization in Julia better. We need better compilation performance, fewer bugs, better support for interactive workflows, more complete documentation, as well as countless other issues. The number of things that can be improved is a testament to how insanely difficult it is to build a visualization platform. It’s perfectly natural to have 10 different solutions, because there are 1,000 different ways to look at a dataset. How could one solution possibly cover everything?

During (and after) JuliaCon 2016, Simon Danisch and I had a bunch of brainstorming sessions diving into how we could improve the core Plots engine. These conversations were mostly centered around strategies to support better performance and interactivity in the Plots API and core loop. We also wanted to give backends more control over lazily recomputing attributes and data, and optional updates to subparts of the visualization (when few things have changed). The goal was marrying extreme flexibility with extreme performance (similar to the goal of Julia itself).

I hope that Simon’s latest project MakiE is the realization of those ideas and goals. I would consider it a big success if he could replace the core of Plots with a new engine, without losing any of the flexibility and features that currently exist. Of course, it will be a ridiculously massive effort to achieve feature-parity without tapping into recipes framework and the Plots API. So my skepticism rests on the question of whether the existing concepts can be mapped into a MakiE engine. I wish Simon the best of luck!

Aside from large rebuilds, there is some low-hanging fruit to a better ecosystem, some of which will be helped by things like “Pkg3” and other core Julia improvements. Also, the (eventual) release of Julia 1.0 will bring a wave of new development effort to fill in the gaps and add missing features.

All things told, I have high hopes for the future of Julia and especially the visualization, data science, and machine learning sub-communities within. I hope to find my way back to the language someday!
Returned value of assignment in Julia

By: Mosè Giordano

Re-posted from: https://giordano.github.io/blog/2017-12-02-julia-assignment/

Today I realized by chance that in
the Julia programming language, like in C/C++,
assignment returns the assigned value.

To be more precise, assignment returns the right-hand side of the assignment
expression. This doesn’t appear to be documented in the current (as of December
2017) stable version of the manual, but
a
FAQ has
been added to its development version. Be aware of this subtlety, because you
can get unexpected results if you rely on the type of the returned value of an
assignment:

julia> let a
         a = 3.0
       end
3.0

julia> let a
         a::Int = 3.0
       end
3.0

In both cases the let blocks return 3.0, even though in the former case a
is really 3.0 and in the latter case it’s been marked to be an Int.

Assignment in the REPL

The fact that assignment returns the assigned value is a very handy feature.
First of all, this is probably the reason why in the Julia’s REPL the assigned
value is printed after an assignment, so that you don’t have to type again the
name of the variable to view its value:

julia> x = sin(2.58) ^ 2 + cos(2.58) ^ 2
1.0

Instead in Python, for example, assignment returns None. Thus, in the
interactive mode of the interpreter you have to type again the name of the
variable to check its value:

>>> from math import *
>>> x = sin(2.58) ** 2 + cos(2.58) ** 2
>>> x
1.0

Using assignment as condition

Another useful consequence of this feature is that you can use assignment as
condition in, e.g., if and while, making them more concise. For example,
consider this brute-force method to compute
the Euler’s number
stopping when the desired precision is reached:

euler = 0.0
i = 0
while true
    tmp = inv(factorial(i))
    euler += tmp
    tmp < eps(euler) && break
    i += 1
end

By using this feature the while can be simplified to:

euler = 0.0
i = 0
while (tmp = inv(factorial(i))) >= eps(euler)
    euler += tmp
    i += 1
end

Can this feature be a problem in Julia?

A common objection against having this feature in Python is that it is
error-prone. Quoting from
a Python tutorial:

Note that in Python, unlike C, assignment cannot occur inside expressions. C
programmers may grumble about this, but it avoids a common class of problems
encountered in C programs: typing = in an expression when == was intended.

This is indeed an issue because in C and Python conditions can be pretty much
anything that can be converted to plain-bit 0 and 1, including, e.g.,
characters. In addition, in Python a variable can freely change the type, so
that

Consider the following C program:

#include <stdio.h>

int main()
{
  char a = '\0';

  if (a = 0)
    printf("True\n");
  else
    printf("False\n");

  if (a == 0)
    printf("True\n");
  else
    printf("False\n");

  return 0;
}

which prints

False
True

Mistyping the condition (= instead of == or vice-versa) in this language can
lead to unexpected results.

Instead, this is mostly a non-issue in Julia because conditions can only be
instances of Bool type. One way to make an error in Julia is the following:

julia> a = false
false

julia> if (a = false)
           println("True")
       else
           println("False")
       end
False

julia> if a == false
           println("True")
       else
           println("False")
       end
True

but it is kind of useless to test equality with a Bool as a condition, since
you can use the Bool itself. The only other possible error you can make in
Julia I came up with is the following:

julia> a = false
false

julia> b = false
false

julia> if (a = b)
           println("True")
       else
           println("False")
       end
False

julia> if a == b
           println("True")
       else
           println("False")
       end
True

For this case I don’t have an easy replacement that could prevent you from an
error, but this is also an unlikely situation. The Julia style guide suggests
to
not parenthesize conditions.
Following this recommendation is a good way to catch the error in this case
because the assignment requires parens:

julia> if a = b
           println("True")
       else
           println("False")
       end

ERROR: syntax: unexpected "="


Publication quality plots in Julia

By: Tamás K. Papp

Re-posted from: https://tamaspapp.eu/post/plot-workflow/

In light of recent discussions on Julia’s Discourse forum about getting “publication-quality” or simply “nice” plots in Julia, I thought it would be worthwhile to briefly summarize what works for me.1 If you are a seasoned Julia user, this post may have nothing new for you, but I hope that newcomers to Julia find it useful.

Generate the data

I try to separate data generation and plotting. The first may be time-consuming (some calculations can take hours or days to run), and I find it best to save the results independently of any plotting. Recently I was sitting at a conference where a presentation about a really interesting topic had some plots that were extremely hard to see: if I remember correctly, something like 10×2 subplots, with almost all fine detail lost due to the resolution of the projector or the human eye. When someone in the audience asked about this, the presenting author replied that he is aware of the issue, but remaking the plots would involve rerunning the calculations, which take weeks. Saving the data separately will ensure that you are never in this situation; also, you can benefit from updates to plotting libraries when tweaking your plots.

For saving results, JLD2 is probably the most convenient tool: while it is technically work in progress, it is stable, fast, and convenient.2 The key question is where to save the data: I find it best to use a consistent path that you can just include in scripts.

You have several options:

  1. define a global variable in your ~/.juliarc for your projects, and construct a path with joinpath,

  2. if you have packaged your code, Pkg.dir can be used to obtain a subdirectory in the package root,

  3. if your code is in a module, you can wrap @__DIR__ in a function to obtain a directory.

For this blog post I used the first option, while in practice I use the second and the third.

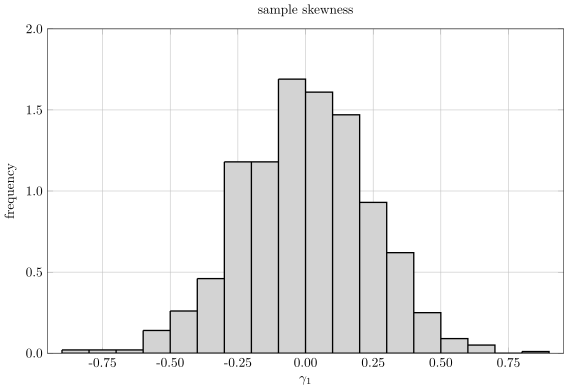
To illustrate plots, I use the code below to generate random variates for sample skewness, and save it.

download as data.jl

using StatsBase                 # for skewness
using JLD2                      # saving data
cd(joinpath(BLOG_POSTS, "plot-workflow")) # default path
sample_skewness = [skewness(randn(100)) for _ in 1:1000]
@save "data.jld2" sample_skewness # save data

Make the plot

No plotting so far, so let’s remedy that. I use Plots.jl, which is a metapackage that unifies syntax for plotting via various plotting backends in Julia. I find this practical, because I can quickly switch backends for different purposes, and experiment with various options when I find the output suboptimal. The price you pay for this flexibility is compilation time, a known issue which means that you have to wait a bit to get your first plot. Separating plotting and data generation has the advantage that once I fire up the plotting infrastructure, I switch to “plotting mode” and clean up several plots at the same time.

Users frequently ask what the “best” backend is. This all depends on your needs, but these days I use the pgfplots() backend almost exclusively.3 The gr() backend is also useful, because it is very fast.

Time to tweak the plot! I find the attributes documentation the most useful for this. For this plot I need axis labels, a title, and prefer to disable the legend since I am plotting a single series. I am also using LaTeXStrings.jl, which means that I can use LaTeX-compatible syntax for labels seamlessly (notice the L before the string).

download as plot.jl

using JLD2                      # loading data
using Plots; pgfplots()         # PGFPlots backend
using LaTeXStrings              # nice LaTeX strings
cd(joinpath(BLOG_POSTS, "plot-workflow")) # default path
@load "data.jld2"                         # load data
# make plot and tweak; this is the end result
plot(histogram(sample_skewness, normalize = true),
     xlab = L"\gamma_1", fillcolor = :lightgray,
     yaxis = ("frequency", (0, 2)), title = "sample skewness", legend = false)
# finally save
savefig("sample_skewness.svg")  # for quick viewing and web content
savefig("sample_skewness.tex")  # for inclusion into papers
savefig("sample_skewness.pdf")  # for quick viewing

Having generated the plot, I save it in various formats with savefig. The SVG output is shown below.

The plot

How to get help

If you cannot achieve the desired output, you can

  1. reread the Plots.jl manual,

  2. study the example plots,

  3. ask for help in the Visualization topic.

For the third option, make sure you include a self-contained minimal working example,4 which also generates or loads the data, so that others can run your code as is. Randomly generated data should be fine, or standard datasets from RDatasets.jl.

Sometimes you will find that the feature you are looking for is not (yet) supported. You should check if there is an open issue for your problem (the discussion forum linked above is useful for this), and if not, open one.

When asking for help or just discussing plotting libraries in Julia, please keep in mind that they are a community effort with volunteers devoting their time to address a very difficult problem. Plotting is not a well-defined exercise, it involves a lot of heuristics and special cases, and most languages took years to get it right (for a given value of “right”). Make it easy for people to help you by making a reproducible, clean MWE: it is very hard to explain how to improve your plot without the actual code and output.


  1. Code in this post was written in December 2017, you may need to tweak it if the API of the packages changes. [return]
  2. In the worst case scenario, you can always regenerate the data ☺ [return]
  3. Note that you need a working TeX installation, which is easy to obtain on Linux. [return]
  4. You should use triple-backticks ``` to format your code. [return]