Re-posted from: http://randyzwitch.com/visualizing-analytics-languages-venneuler-jl/
It often doesn’t take much to get me off track, and on a holiday weekend…well, I was just begging for a fun way to shirk. Enter Harlan Harris:
someone redo this area-prop’l Venn w/ my Julia pkg! http://t.co/Mh8rXZbRgY http://t.co/RDWNQHTw3S http://t.co/ljujd9DG0T via @revodavid
— Harlan Harris (@HarlanH) August 29, 2014
Hey, I’m someone looking for something to do! And I like writing Julia code! So let’s have a look at recreating this diagram in Julia using VennEuler.jl (IJulia Notebook link):
Source: Revolution R/KDNuggets
Installing VennEuler.jl
Because VennEuler.jl is not in METADATA as of the time of writing, instead of using Pkg.add() you’ll need to run:
Pkg.clone("https://github.com/HarlanH/VennEuler.jl.git")
Note that VennEuler uses some of the more exotic packages (at least to me) like NLopt and Cairo, so you might need to have a few additional dependencies installed with the package.
Data
The data was a bit confusing to me at first, since the percentages add up to more than 100% (people could vote multiple times). In order to create a dataset to use, I took the percentages, multiplied by 1000, then re-created the voting pattern. The data for the graph can be downloaded from this link.
Code – Circles
With a few modifications, I basically re-purposed Harlan’s code from the package test files. The circle result is as follows:

Since the percentage of R, SAS, and Python users isn’t too dramatically different (49.81%, 33.42%, 40.97% respectively) and the visualizations are circles, it’s a bit hard to tell that R is about 16% points higher than SAS and 9% points higher than Python.
Code – Rectangles
Alternatively, we can use rectangles to represent the areas:
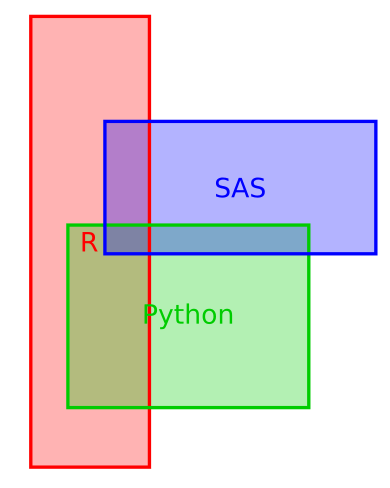
Here, it’s a slight bit easier to see that SAS and Python are about the same area-wise and that R is larger, although the different dimensions do obscure this fact a bit.
Summary
If I spent more time with this package, I’m sure I could make something even more aesthetically pleasing. And for that matter, it’s still a pre-production package that will no doubt get better in the future. But at the very least, there is a way to create an area-accurate representation of relationships using VennEuler.jl in Julia.